Update as of July 16,2011: See the resignation of Les Hinton as WSJ CEO due to his role as head of Murchoch’s News of the World during its most scandalous period of phone hacking and police bribes which Les claims he was unaware of. Also see NYTimes Joe Nocera with his own mea culpa for supporting the News Corp takeover of Dow-Jones and the WSJ back in 2007 with the resulting decline in quality under Les Hinton’s direction. In the recent coverage of the Murdoch scandal, the WSJ has been found wanting by first ignoring the story and then shilling the Murdoch Party line.
The Wall Street Journal: Sins of Omission
As a reader one expects the Wall Street Journal to be comprehensive, open and detached . One expects an approach, like the CBO -Congressional Budget Office, of respected non-partisan analysis by the WSJ of the economic and financial situation. On the critical Budget Deficit debate the Journal has been guilty of deliberate omission and simply missing in action on providing a critical analysis of the tax deficit issues facing not just the federal government but also state and local governments too.
Omission of Critical Facts
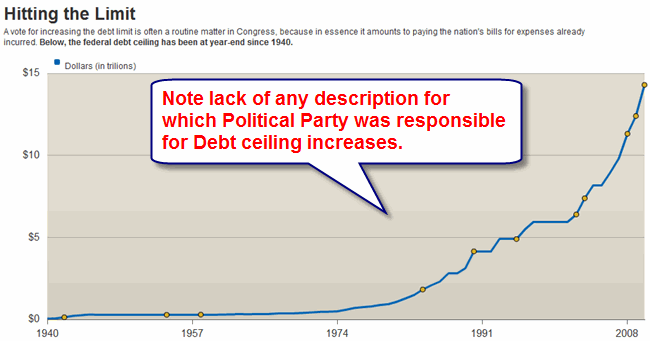
The following example from today’s WSJ is one of many where the Journal just omits critical facts from its readers. It is from the Policy and Politics section. This is an underachieving chart on the spike in national debt:
Above is the Journal’s Interactive Graphics contribution to the Budget Deficit debate. In contrast see how the CBO covers the budget issue:
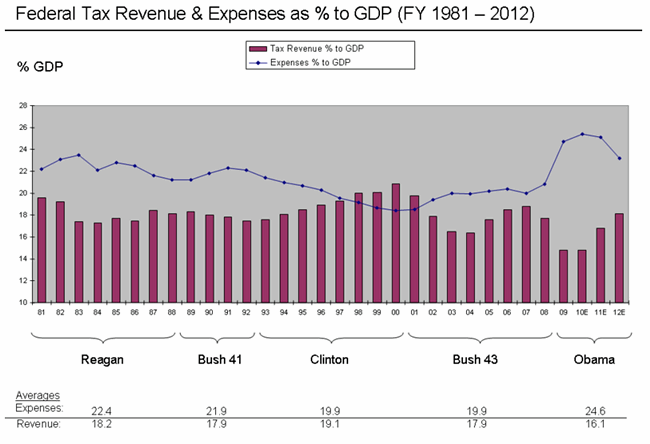
In contrast to the Journal, the CBO-Congressional Budget Office labels the bottom axis with which political party was in Presidential power for significant shortfalls in the Federal budget leading to bigger overall deficit. This is very relevant to the current budget ceiling debate because as the chart above and the table below shows, the GOP has been almost solely responsible for the massive increase in the deficit with its “Starve the Beast” policy of not paying for large increases in expenditures . As well the GOP’ is rejecting the “Pay as You Go” policy of the Democrats which was very successful in the the Clinton years of creating a budget surplus and cutting the deficit.
Now the Journal will claim that its chart is properly labeled – all a user has to do is take their mouse and hover it over the little yellow diamond icons and one will see a popup hint that discloses every one of the deficit limit increases since 1980 has been done under a Republican President except the last[but that was after Bush handed off an economy in ruins to Obama]. The table below, which shows the increase in the debt as a % of US GDP, illustrates the cumulative effect of Republican “Starve the Beast” overspending.
| U.S. president | Party | Term years | End debt/GDP | Debt Rise | Debt/GDP% Change |
|---|---|---|---|---|---|
| Roosevelt/Truman | D | 1945–1949 | 93.1% | $5oB | –24.4% |
| Harry Truman | D | 1949–1953 | 71.4% | $10B | -21.7% |
| Dwight Eisenhower | R | 1953–1957 | 60.4% | $10B | -11.0% |
| Dwight Eisenhower | R | 1957–1961 | 55.2% | $20B | -5.2% |
| Kennedy/Johnson | D | 1961–1965 | 46.9% | $30B | -8.3% |
| Lyndon Johnson | D | 1965–1969 | 38.6% | $50B | -8.3% |
| Richard Nixon | R | 1969–1973 | 35.6% | $70B | -3.0% |
| Nixon/Ford | R | 1973–1977 | 35.8% | $190B | +0.2% |
| Jimmy Carter | D | 1977–1981 | 32.5% | $280B | -3.3% |
| Ronald Reagan | R | 1981–1985 | 43.8% | $660B | +11.3% |
| Ronald Reagan | R | 1985–1989 | 53.1% | $1.04T | +9.3% |
| George H. W. Bush | R | 1989–1993 | 66.1% | $1.40T | +15.0% |
| Bill Clinton | D | 1993–1997 | 65.4% | $1.18T | –0.7% |
| Bill Clinton | D | 1997–2001 | 56.4% | $450B | –9.0% |
| George W. Bush | R | 2001–2005 | 63.5% | $1.73T | +7.1% |
| George W. Bush | R | 2005–2009 | 83.4% | $2.63T | +20.0% |
The Wall Street Journal has chosen to hide these GOP overspending facts from its readers making its readers interested in the Deficit policy a)unaware of the GOP record of massive overspending and b)more subject to stridency and gamesmanship like the current Budget Deficit Ceiling Game of Chicken that has even the Street worried.
Missing the Context
The Budget Deficit needs to be addressed in its full context. Thus, the “Pay As Go You Policy” implies =>spending increases have to be matched by tax increases or spending cuts elsewhere. Likewise, tax cuts have to be matched by tax reforms of equal value or program spending cuts. The Congressional temptation is to label some spending programs or tax cuts as emergency measures as in the case of the temporary Bush Tax cuts that a)were not matched with corresponding spending cuts and b)have almost become permanent. The WSJ has been virtually mum about how taxes a)have declined both absolutely and as a % of income total income and b)tax breaks/expenditures have become dysfunctional in their distortion of markets and c)how the current GOP policy of taking taxes out of the equation in balancing the budget is simply irrational. This omission by the Journal is a serious breech of trust of keeping its readers informed on financial and economic matters of import and impact.
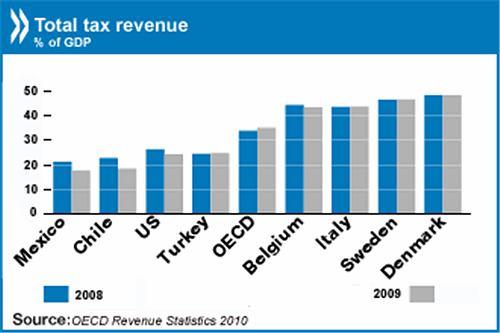
But the Journal is missing in providing details for the US Budget debate in a global comparison context . The following is a graphic from the OECD:
The chart above [with overview here] shows that the US has the third lowest overall tax burden, at 24%, among all OECD’s developed countries. This info available from the OECD and others is the type of contextual goverment spending coverage that is completely missing from the Journal. For example, the Journal’s readers do not know that Greece, Ireland, New Zealand and the United States showed declines of 3-4 percentage points from 2007 – 2009 in tax revenues while all 4 countries are currently confronting budgetary crises. Or that falling corporate income tax revenues account for half of the fall in the average overall tax burden between 2007 and 2009 in OECD countries or that the following changes in tax structure have occurred:
- Social security contributions to total government revenues in OECD countries increased from 18% in 1965 to 25% in 2008 while corporate income taxes rose from 9% to 10%.
- The share of personal income taxes – 26% in 1965 – was 25% in 2008.
- The share of taxes on consumption fell from 36% in 1965 to 30% in 2008. But the mix of taxes on goods and services has also fundamentally changed. General consumption taxes (e.g. VAT) produced 20% of total revenue in 2007 compared with 12% in the 1960s. However this has been accompanied by a larger fall in other specific consumption taxes whose share has declined from 24% to 10%
- The share of property taxes fell from 8% in 1965 to 5% by 2008.
All of these facts and data are vital to making an informed decision on the budget debate are not being supplied by the Journal. Yet clearly context for this debate is very relevant because the GOP portrays the US as overburdened with taxes and has forgotten its role in creating the deficit situation.
Summary
As a regular newsstand reader of the Wall Street Journal I have been taken aback by its coverage of the Budget Debate and the policy issues. I depend on the Journal to provide not just isolated facts but the context around important issues. But clearly the Journal has been remiss in its coverage but also is now starting to do editorial omissions and hiding reminiscent of its News Corp media cohort, Fox News. The last thing I want as an investor is propaganda presented as news a la the Fox News mode.


